
Step-by-Step Guide:
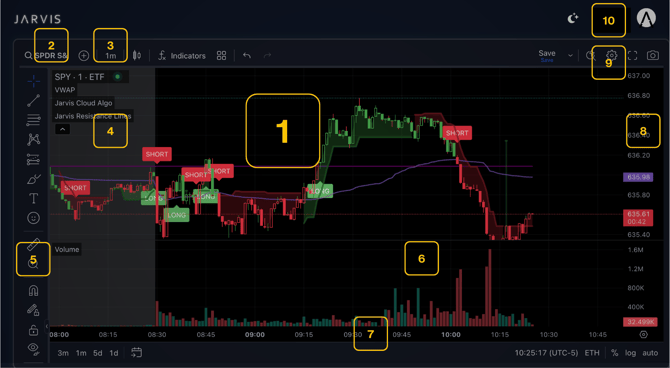
1. Trade Ticker
-
Displays the real-time trading feed
-
Shows Jarvis Long & Short signals and the Jarvis Cloud
2. Symbol Search
-
Default: SPY
-
Click to search any symbol by typing its abbreviation and pressing Enter
3. Candle Duration
-
Default: 1-minute candles
-
Select intervals from 1 minute up to 1 hour
4. Indicator Settings
-
Toggle VWAP, Cloud Algo, and Resistance Lines
-
Add, remove, or adjust color preferences
5. Drawing Toolbar
-
Annotate charts with drawing tools
-
Refresh your browser to clear all drawings
6. Volume Tracker
-
Displays real-time trading volume for the active symbol
-
Drag the top line to resize
-
Hover top-right to Delete Pane
7. Timeline & 8. Priceline
-
Click and drag to rescale
-
Scroll wheel also adjusts view
9. Additional Settings
-
Save and load unique ticker layouts
-
Customize candles, lines, and background appearance
10. User Home Link
-
Manage account settings, billing, and subscription
Priority support available:
- Live Chat: Available 24/7 with live agents online between 9-3 CST
- Email: support@tradewithjarvis.com
- Discord: #tech-support channel